


"mysterious symbols of a foreign realm":
EEG and SPECT

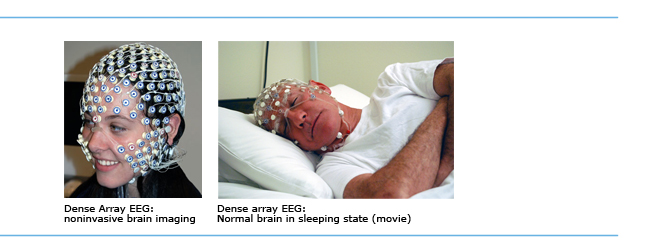
EEG
Electroencephalography (EEG): The recording of electrical activity along the scalp produced by the firing of neurons within the brain.
This file shows the electrical activity with a normal brain in a sleeping state. The image in the middle depicts the EEG waveforms or "traces". As the movie plays you see brief large amplitude activity. This is actually from eye movement. We also see periods of relatively flat lines and then distinct oscillations. These are typical as the brain moves into different sleep stages. Around the central image are additional ways to view the same information.
To the upper right we have a color map showing the color mapping of the electrical data on the patient's scalp. Yellow corresponds to a large positive voltage value, while black represents negative voltage values. This recording was performed with 256 channels of EEG. This type of view is called a Topo Map since it shows the topography of the voltage information on the scalp.
It can be difficult to see all of the information so the bottom right view shows all 256 channels plotted on top of each other. This is called a butterfly plot. Here we can easily pick out patterns.
In the bottom center we have a Synoptic Plot where we use the same color mapping of the Topo Map but show all 256 channels stacked one above the other.
To the left we have what are perhaps the most striking images. On the upper left we see the electrical activity recorded at the scalp, mapped back onto the cortical surface of the brain. The same color mapping is used here as in the other images. As we play the movie you can see the black line from each color square changing in length and direction. This line shows the direction and strength of the electrical dipole that is generating the EEG. In the past it was thought that you could represent the bulk of the EEG data with just a few well-placed dipoles. Over the past decades, researchers have built a more dynamic model of the brain. Here, EGI uses its software to model the electrical activity on thousands of voxels (the squares). Some areas are quiet while others show a lot of activity. The background images may look familiar to you. These are MRI images.
On the bottom left hand side of the movie we show the Flat Map of the brain. Not everyone is used to looking at three axes of MRI images at once. To get a better feel for how the signals are connected, we use the Flat Map. The flat map is made by inflating a virtual brain and then showing the left and right hemispheres. The same information that is displayed on the MRI slices is shown here.
To analyze the EEG data, a physician or researcher has a variety of tools available. Different ways of looking at the same information can make specific items of interest pop out into view. This movie shows just a small set of different tools. When a patient is assessed it often takes a combination of imaging techniques to build up the full picture. Courtesy of EGI.
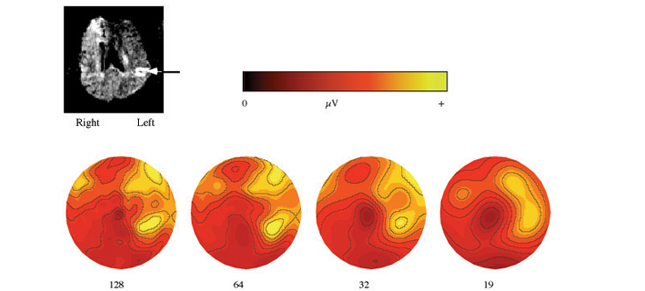
This 80-year-old woman was found slumped in her chair in her assisted living home. The diffusion-weighted MRI performed 2.5 hours after admission showed an ischemic region in the left hemisphere (all images in this frame are left on the right for comparison). The 128 channel EEG recorded 3.5 hours after admission (leftmost) showed focal delta and theta (the maps here show the amplitude in the 1 to 3 Hz or delta band.) Courtesy of EGI.
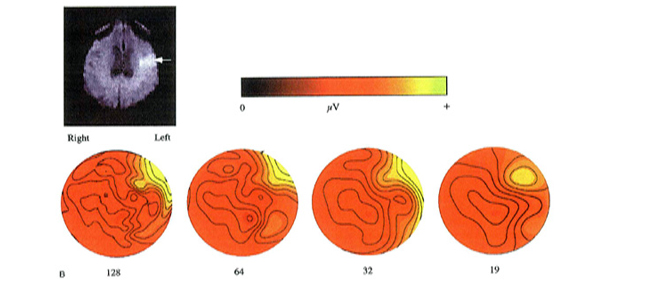
This patient is an 81-year-old woman who presented with acute onset of expressive aphasia, without other neurologic symptoms or signs. The MRI performed approximately 5 hours after symptom onset, revealed a posterior, left frontal lesion on the diffusion-weighted image. The EEG was collected approximately 8 hours after symptom onset. Analysis of the EEG spectrum revealed a left lateralization of slow-wave activity centered over the posterior, left frontal recording sites and extended into the left temporal leads. This distribution of slow-wave activity is consistent with the diffusion-weighted image findings. Courtesy of EGI.

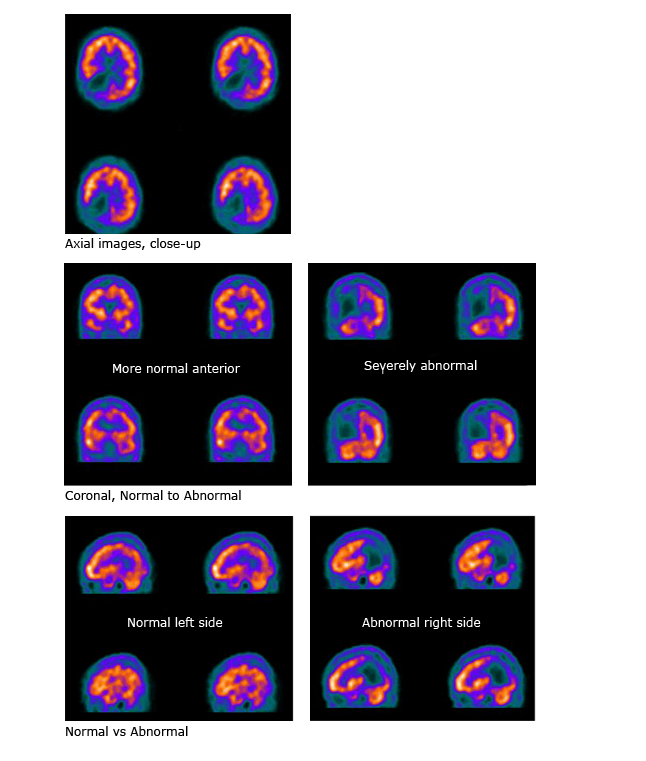
SPECT
Single Photon Emission Computed Tomography (SPECT): A nuclear medicine tomographic imaging technique using gamma rays, able to provide functional, 3-D information
Imaged from above looking down ("axial" plane); comparison of normal with abnormal viewed from front ("coronal" plane). Courtesy of David K. Shelton, M.D., UC Davis Medical Center, Nuclear Medicine.
All rights reserved.